The legendary chart that still governs the NFL draft was an inexact estimate of a 1980s market. Its creator, the Dallas Cowboys, never intended to guide hundreds of draft-day trades for decades to come, but here we are. When the 2022 bonanza begins Thursday in Las Vegas, general managers will answer phones, haggle over picks and reference this outdated rubric.
Its purpose, ever since 1991, has been to quantify the relative value of draft picks. It posits, for example, that No. 1 overall is worth the same as Nos. 3, 35 and 68. As it spread from Jimmy Johnson’s Cowboys across the league, it took on Johnson’s name, and became “the standard that trades are made by,” as Jerry Jones once said. In fact, some believe it encouraged the wheeling and dealing that now defines the draft, because its point values provided a lucid roadmap, and protected GMs who worried about getting fleeced.
“The Chart,” however, had and continues to have one glaring flaw: It isn’t particularly good.
The 21st century brought data to football. Dozens of analysts have since shown that the Jimmy Johnson chart overvalues early picks. Some of those analysts have infiltrated front offices, and many GMs now realize this as well.
“I would agree that it probably overvalues especially the top half of the first round,” Buffalo Bills GM Brandon Beane told Yahoo Sports.
The degree to which it does is debated. The broad conclusion, though, has neared consensus. Most NFL teams now curate different charts. Many concoct their own in-house. The Bills, Beane said, have one that’s “analytically built.” Some teams consult multiple models, including ones that are public, and design computerized systems that allow GMs to plug in pick numbers and evaluate offers at the click of a mouse.
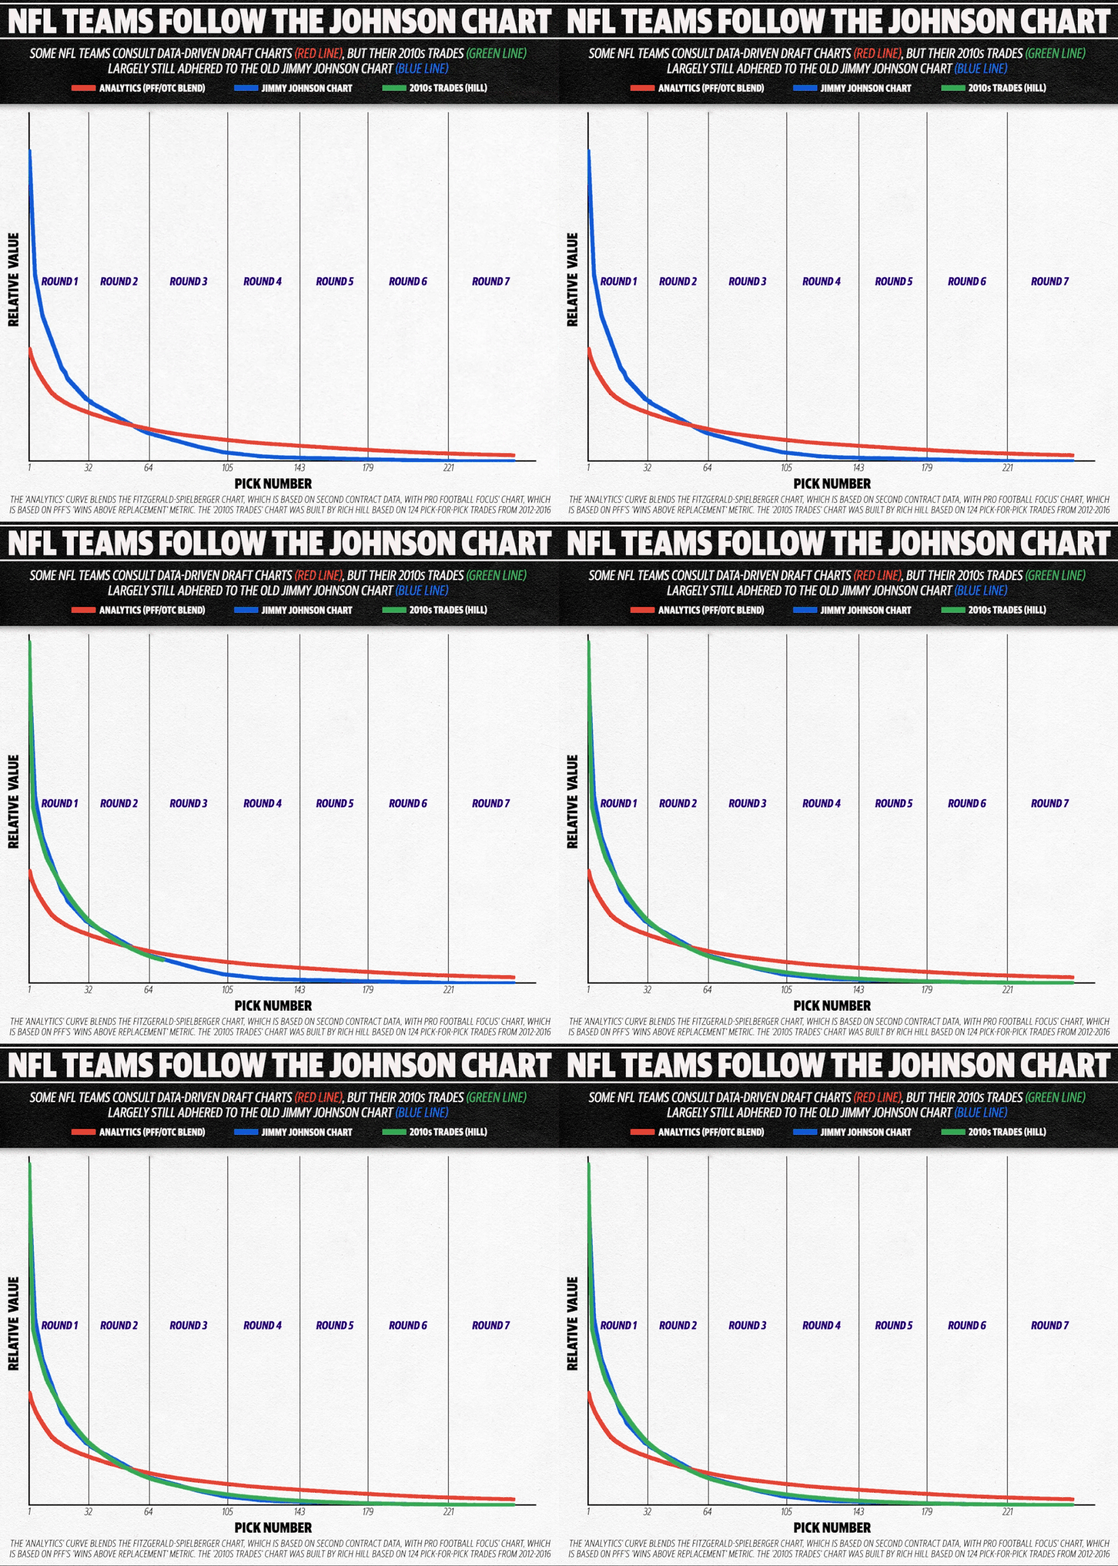
And yet, according to GMs and quants who’ve worked with them, many teams still turn to the Johnson chart, or at least an updated version of it. Many pick-for-pick negotiations still fall back on it. Attempts to adapt it to the modern market, based on 2010s trades rather than late-1980s trades, have produced a remarkably similar curve, a sign that teams still follow the faulty conventional wisdom.
Many decision-makers recognize the chart’s flaws, but a variety of factors — the pressure of draft day, an overconfidence in scouting, market quirks and more — keep pushing them back toward it.
“It’s still,” Beane said, “a foundational chart used around the league.”
Beholden to ‘The Chart’
NFL teams have been trading draft picks since the 1930s, maneuvering strategically but often unscientifically. In the early 90s, after dealing Herschel Walker for a massive haul of draft picks, the Cowboys set out to appraise the market. Mike McCoy, a Jerry Jones business partner and Cowboys vice president, compiled every pick-for-pick trade from 1987 through 1990, and found “a real, definite trend.”
Other NFL teams had as well. The 1980s Bills, led by longtime personnel director Norm Pollom, had developed their own system. “We kept a historical record, going back five years, of every trade that was made,” says Bill Polian, a member of those Bills staffs. “We established norms as to what each particular pick would merit,” and they, too, saw “clear trends.”
The Cowboys, though, devised the digestible price list that stuck. They assigned round, whole numbers to each of the draft’s 200-plus picks. No. 1 was worth 3,000 points. No. 2 was 2,600, and No. 6 was 1,600. No. 31 was worth 600, and so on, all the way through the late 12th-rounders who were virtually worthless.
Their chart, though, was not a calculation of how teams should value picks. The Bills’ system, Polian confirms, “wasn’t advanced math.” These were rough approximations of how teams had valued picks in the recent past. And in the 2000s, economists and football statisticians began to argue that teams should value picks differently.
The new charts came from distinguished professors, NFL bloggers and Harvard undergrads. They primarily used two types of metrics, salaries and single-number player ratings, to gauge the expected performance of prospects chosen at every draft slot. They’ve since been refined, most notably by Pro Football Focus and Over The Cap. They often suggest that the Jimmy Johnson chart overvalues the top 50 picks while undervaluing the third round onward.
Values at the very top are especially inflated, as Beane said. The Jimmy Johnson chart says the first pick is more than four times as valuable as the 24th. PFF’s chart, based on Wins Above Replacement, says it’s merely twice as valuable.


The analysis is rooted in a simple phenomenon: “It’s really hard to evaluate NFL talent,” says Michael Lopez, the league’s director of football data and analytics. The first-round “bust rate” remains high. The relative value of top picks, Lopez found in a study before joining the league, is significantly lower in the NFL than in the NBA, NHL and even MLB.
The analytics community has consistently urged teams to accept the draft’s uncertainty and sacrifice quality picks for quantity. “It’s proven that no team can consistently outperform the expectations of their draft slot,” says Brad Spielberger, a PFF analyst who co-wrote a book on the draft. “You want to have as many dart throws as possible.”
Baltimore Ravens GM Eric DeCosta recently summarized the philosophy: “Teams should always trade back and acquire picks, and never trade up. You should always accumulate, because the draft is basically a luck-driven process,” he told former Atlanta Falcons GM Thomas Dimitroff. “If you have 10 or 12 draft picks in any given year, even if you suck at drafting, you’re probably gonna hit on five or six picks.”
NFL teams, however, often haven’t listened. Rich Hill, a writer at Pats Pulpit, analyzed five years of trades after the 2011 implementation of the rookie wage scale, and found they closely mirrored the original Cowboys chart. There are hints that behavior has begun to shift, slightly, slowly, but precedent still pulls GMs back to the 80s.
The Chart, Spielberger says, “remains the controller of the marketplace.”
Are superstars different?
The justifications for this inefficient behavior range from astute to spineless. Beane reasons that the “charts are a baseline,” and actual value varies by position and season. The No. 1 overall pick in 2021, many agree, was far more valuable than this year’s top selection, because Trevor Lawrence was far more valuable than the non-QB who’ll go first in 2022.
“You have to evaluate [the class] yourself each year, and where’s the depth of the draft by round, and where’s the depth of the draft by position,” Beane said.
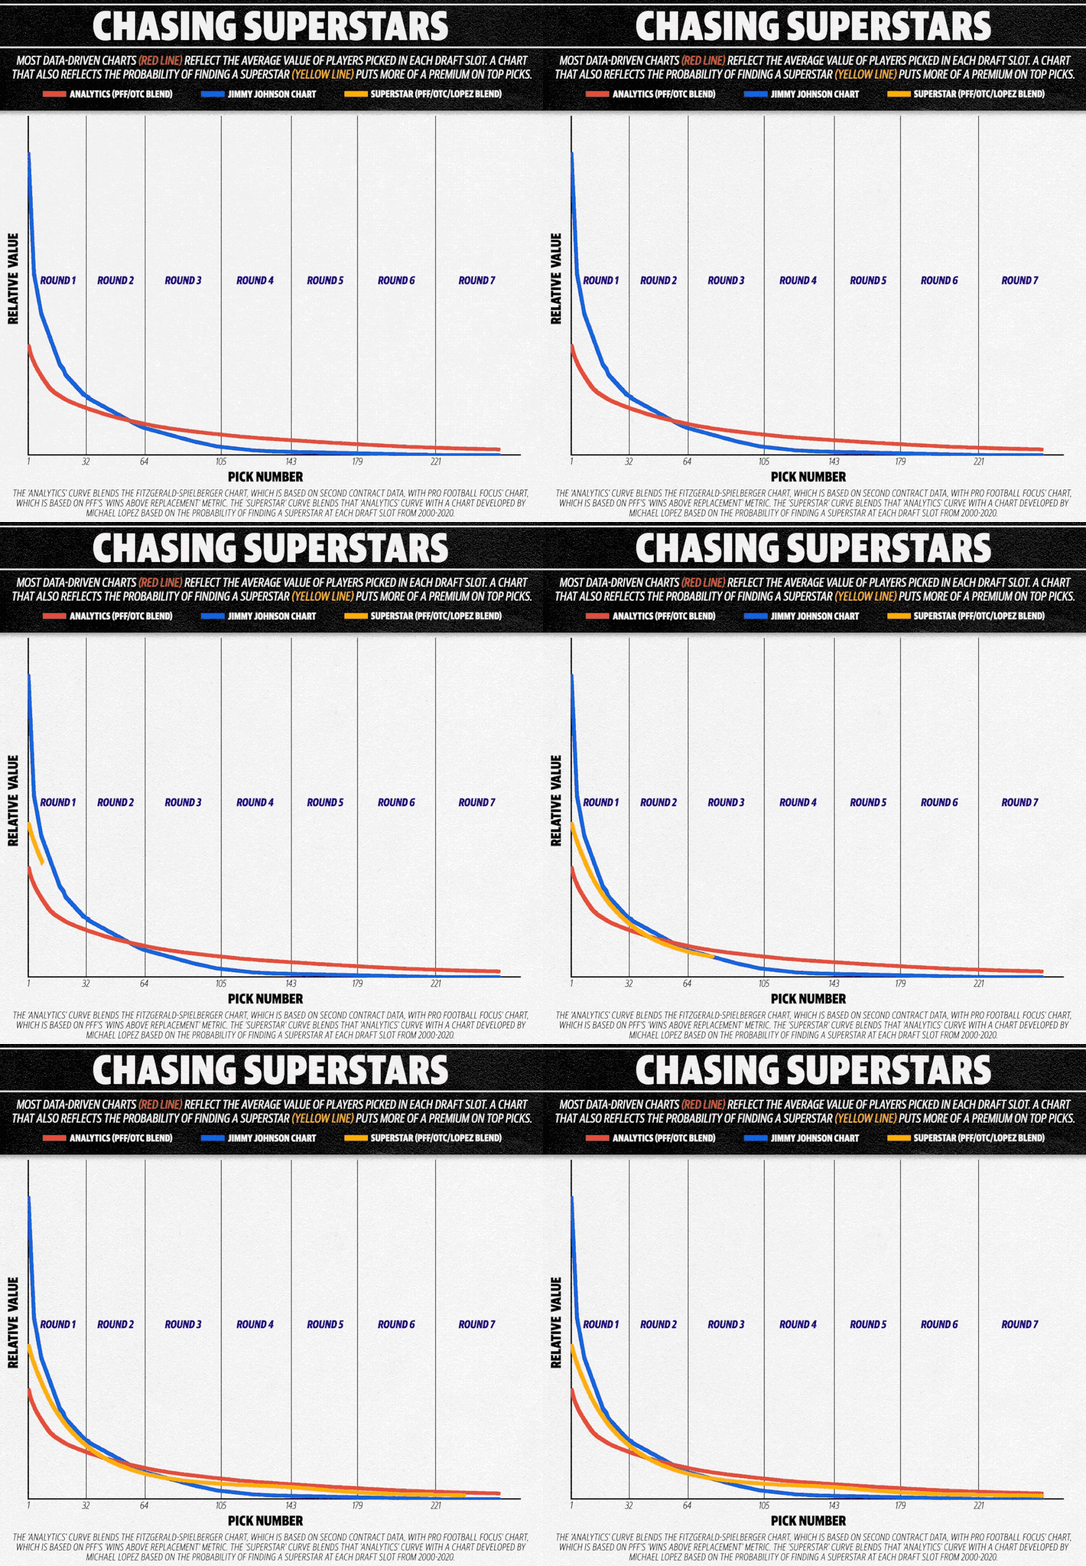
GMs also have to decide what they want out of a draft. If a team solely cares about unearthing a superstar, its draft curve would be steeper. Some analysts have questioned the utility of charts grounded in average performance, and instead charted the probability of finding elite performance at each draft slot. Doing so, or even crafting a hybrid chart that combines a “superstar” curve with a blended salary-WAR curve, yields valuations in between the Johnson chart and the most common analytics-based charts.


Multiple NFL teams have charts that consider this “superstar probability,” according to a source familiar with analytics departments around the league. Most teams declined to make GMs and staffers available for interviews, and some cited the secrecy around proprietary charts as a reason, but Beane described his, and it seemed to align with the probabilistic approach.
It’s based on “historical data” and the Bills’ “pro grading scale,” he explained. “You start with Pro Bowl-type players, to really good starters, to average starters, to eventual starters, to good backups — you just work your way down into buckets. We use that, and look at drafts of the past, and … now that they have several years-plus in the league, where [in the draft] are these guys being found?”
Beane also emphasized a caveat that the analytics community has increasingly accepted. Even Cade Massey, a University of Pennsylvania professor who co-authored a seminal paper exposing the overvaluation of top picks, acknowledges the exception: “It’s different for quarterbacks.”
In 2018, Beane famously traded up for one. He sent two second-rounders to Tampa to move from No. 12 to 7. The price was extreme, an overpay according to every chart, including Buffalo’s. The Buccaneers were clear winners, and proof of concept for “trade down” advocates when they turned the three “dart throws” into one Pro Bowler, three starters and ultimately three Super Bowl champions.
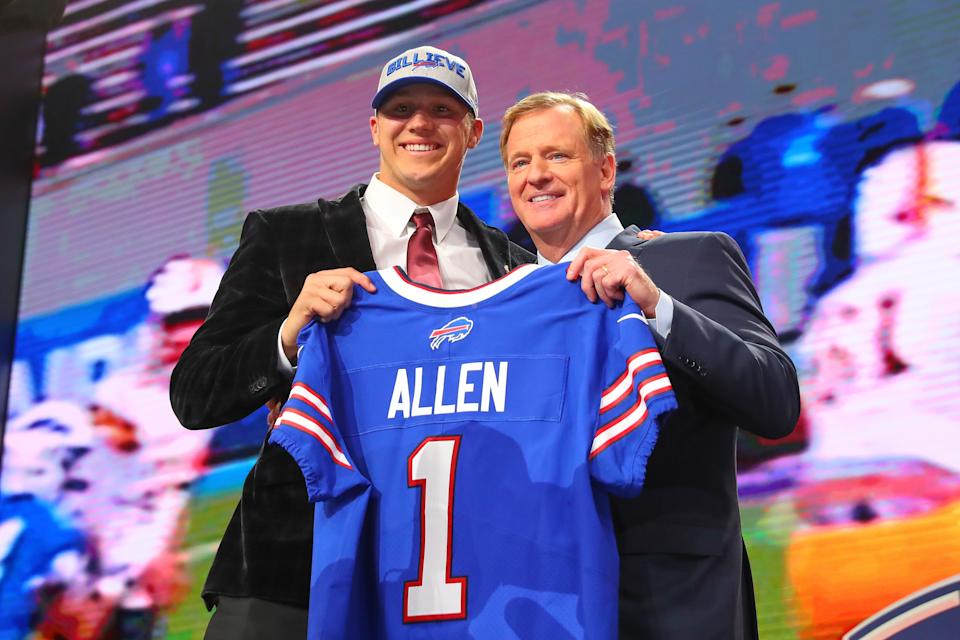
The trade, though, was also the best of Beane’s career. It procured Josh Allen, and transformed Buffalo into a contender.
“The trade chart, you throw it out the window, in a lot of aspects, if you’re trading up for a franchise quarterback,” Beane said.
Analysts wouldn’t quite go that far. The “franchise quarterback,” of course, could be Blake Bortles or Josh Rosen. When asked whether a QB-specific curve matches the Jimmy Johnson curve, Massey laughs. “No,” he says. “No, no, no, no, no.”
Kevin Meers, who built an early chart and worked in the Cleveland Browns’ analytics department for six years, says it’s “easier to justify” paying a draft-day premium if the target is a quarterback, “but it’s not something I would often advocate for. Because the primary point is, the draft is so uncertain that you tend to be better off taking more shots.”
Teams routinely underestimate this uncertainty. They pay scouts handsomely for opinions, and trust those opinions over decades of research suggesting the uncertainty is unsolvable at scale. So, for example, they see a player sitting at No. 11 on their draft board, but falling to pick No. 18 on Thursday night. They forget the quantity-over-quality axiom, decide they absolutely must trade up, and pay an 11th-pick price for the 18th pick to “go get their guy.”
In the background, some teams have recalibrated draft charts to reflect analytics, and largely avoid mistakes. But trades between two of those teams don’t always happen. The ones that do happen often involve one team willing to pay Johnson prices, so the market remains stuck in 1991.


The comfort of old reliable
What, exactly, NFL teams use to guide their maneuvering remains a mystery. Several GMs, from Beane to Detroit’s Brad Holmes to New England’s Bill Belichick, have said they work off their own charts, but it’s unclear how most internal charts are crafted. One data analyst who worked for multiple NFL teams told Yahoo Sports that “every GM I worked with used multiple charts that are basically just variations of the Jimmy Johnson chart.”
“Each GM has the two or three charts that they kind of look at, none of which are particularly data-driven, in my experience,” he said.
Another analyst said he knew of one club that, as of a couple years ago, “just didn’t really care, and only used Jimmy Johnson.”
Holmes confirmed the Lions “do look at the Jimmy Johnson” chart. The vast majority of teams now look elsewhere as well, but the original chart continues to be either a “jumping-off point” or an 11th-hour common ground — “just because it is at least something uniform that everyone has,” Beane explained.
“The problem with using your own modified chart, an adjusted chart — which is probably exponentially more effective than the first chart that was out there — there was no synchronicity,” Dimitroff said last year. It was as if teams were “talking two different languages,” he explained, so they’d end up “folding back into the traditional chart.”
The savvy teams, three analysts said, negotiate on Johnson terms while simultaneously using data-driven charts to identify bargains. But only the front offices with top-down commitments to analytics end up acting on the analytical charts. The Johnson chart, Massey said, is “a real easy coordination device in a difficult, ambiguous, high-pressure situation.” The chaotic rush of draft day, with phones ringing and clocks ticking, leads fallible humans back to the comfort of old reliable.
Some GMs also worry about public perception, according to Massey, who’s consulted with NFL teams. “There are decision makers, and people who influence decision makers, who don’t want to do deals that look like they’re bad deals relative to the traditional chart,” he said, because the traditional chart is the one most fans and media see.
“The appearance of the quality of the trade, just the appearance, given that everybody knows those values, is a bit of a constraint on what they wanna do,” Massey said. “The public nature of decision-making in professional sports is just more complicated than we analysts like to make it sometimes.”
The executives who overcome it are the ones backed by what Massey calls “organization will,” the ones empowered to trust data over ingrained practices. “You 100% have to know in advance, and everybody has to be on the same page, that you’re gonna trade according to some other model,” he explains.
“It takes a lot. And that’s why we see so little of it.”
